- DATE:
- AUTHOR:
- The Hopin Events team

Analytics Improvements
You'll now find two small but important updates related to analytics in your event dashboard that will help you measure, analyze, and export your attendee data from your Events.
1. View your attendees right inside your event dashboard.
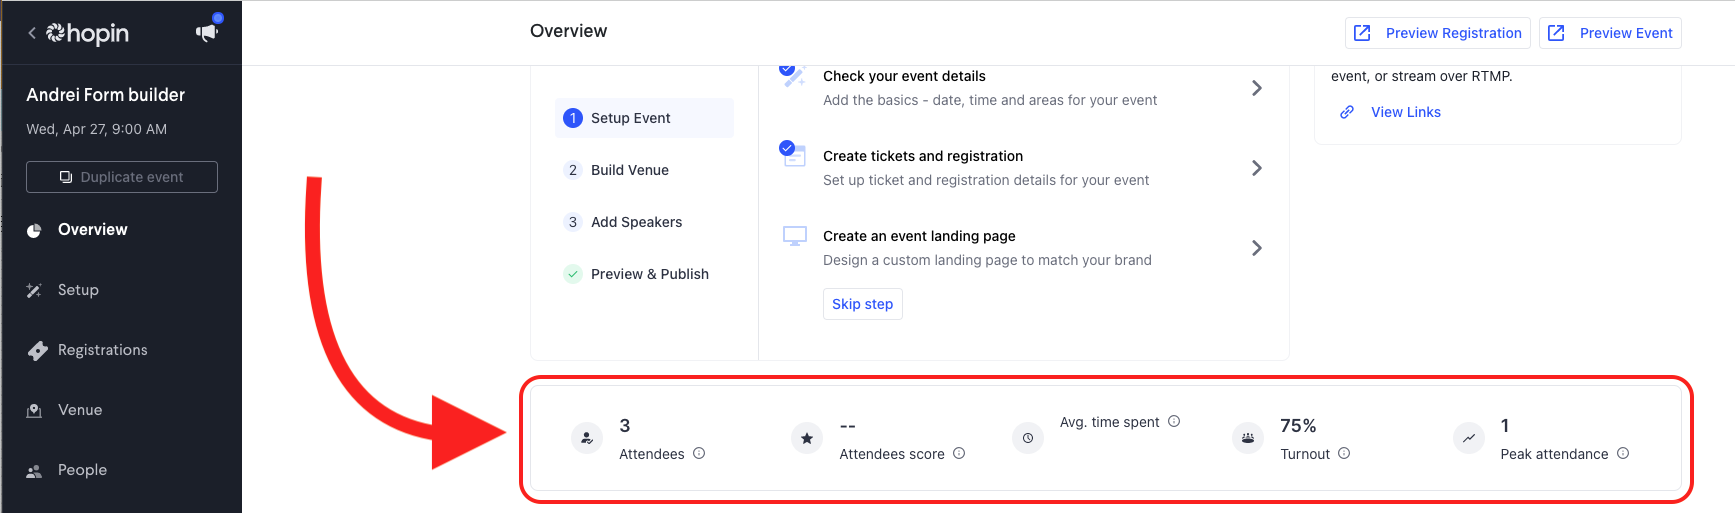
You can now see from your event dashboard the number of attendees who attended the event, including the attendee score, average time spent in the event, turnout rate, and peak attendance.
This attendee data is exportable via Analytics>>>Reports.
2. View and export your post-event survey feedback data.
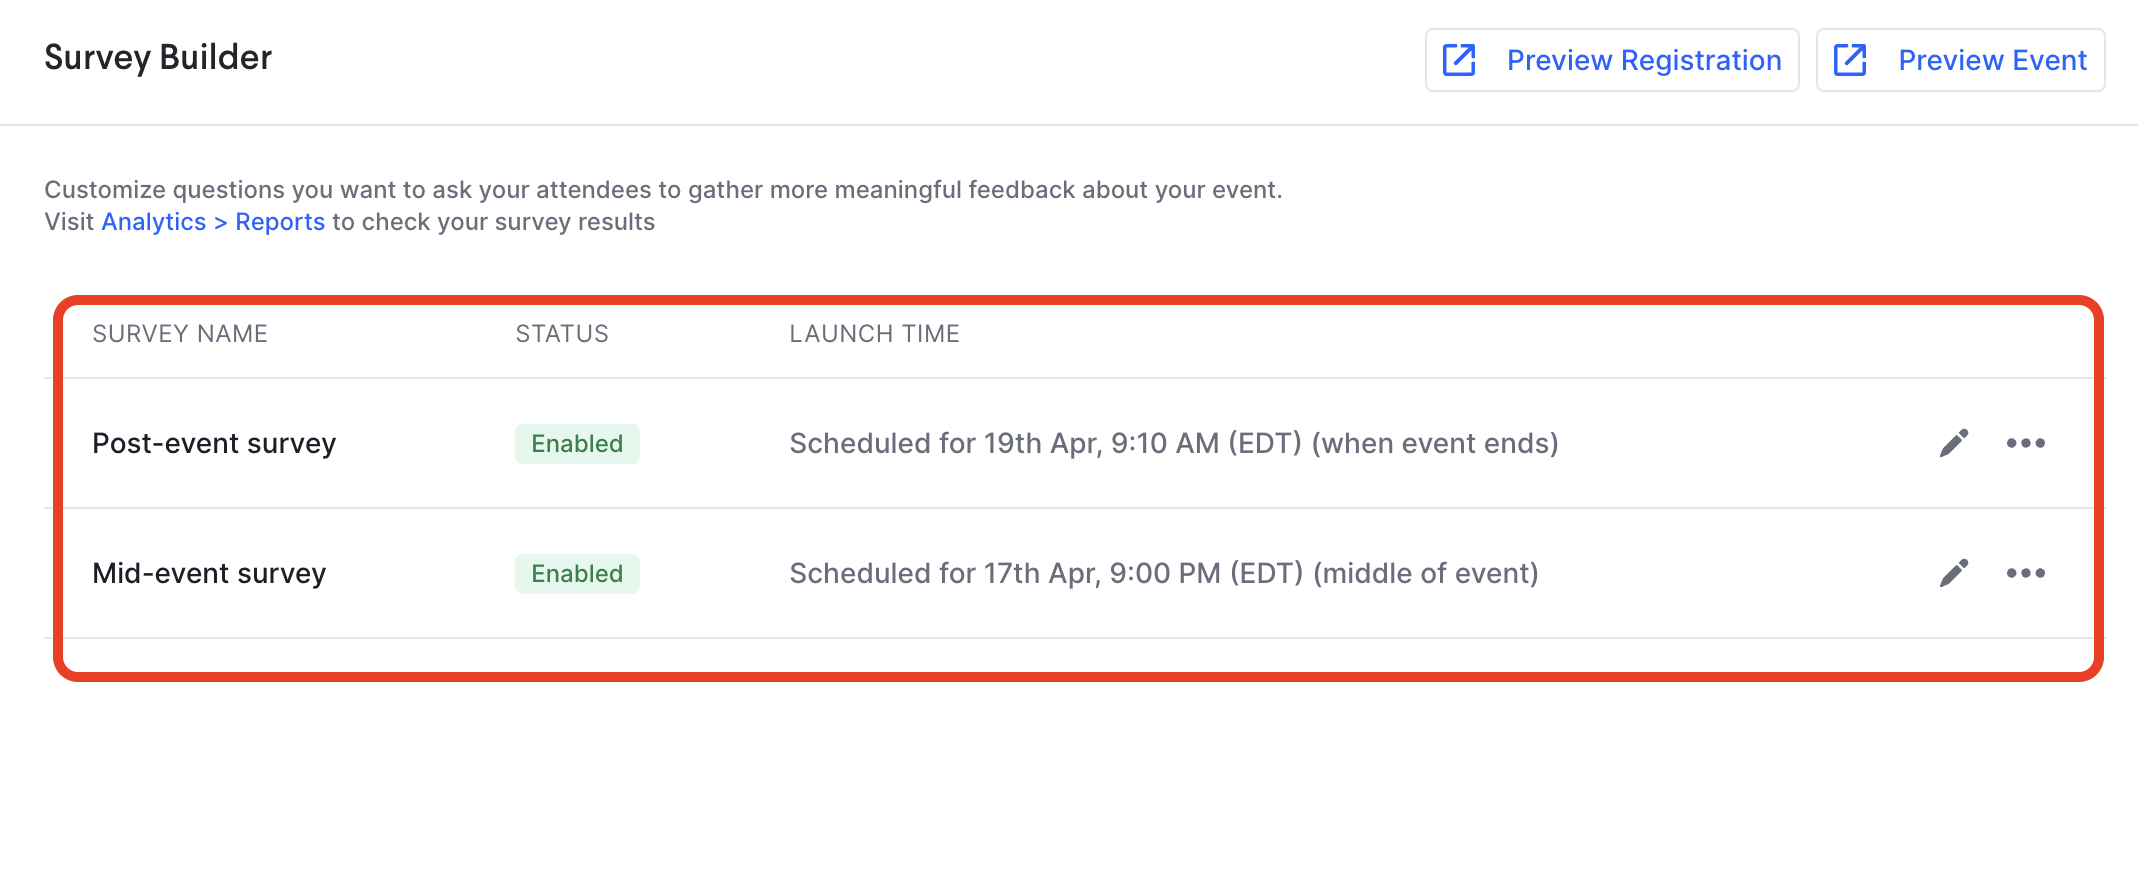
In your Hopin event, you can automatically trigger two attendee surveys at set times. While the default is one in the middle and one at the end, you can schedule these to show at anytime. These surveys are customizable in your organizer dashboard under Venue>>>Survey Builder.
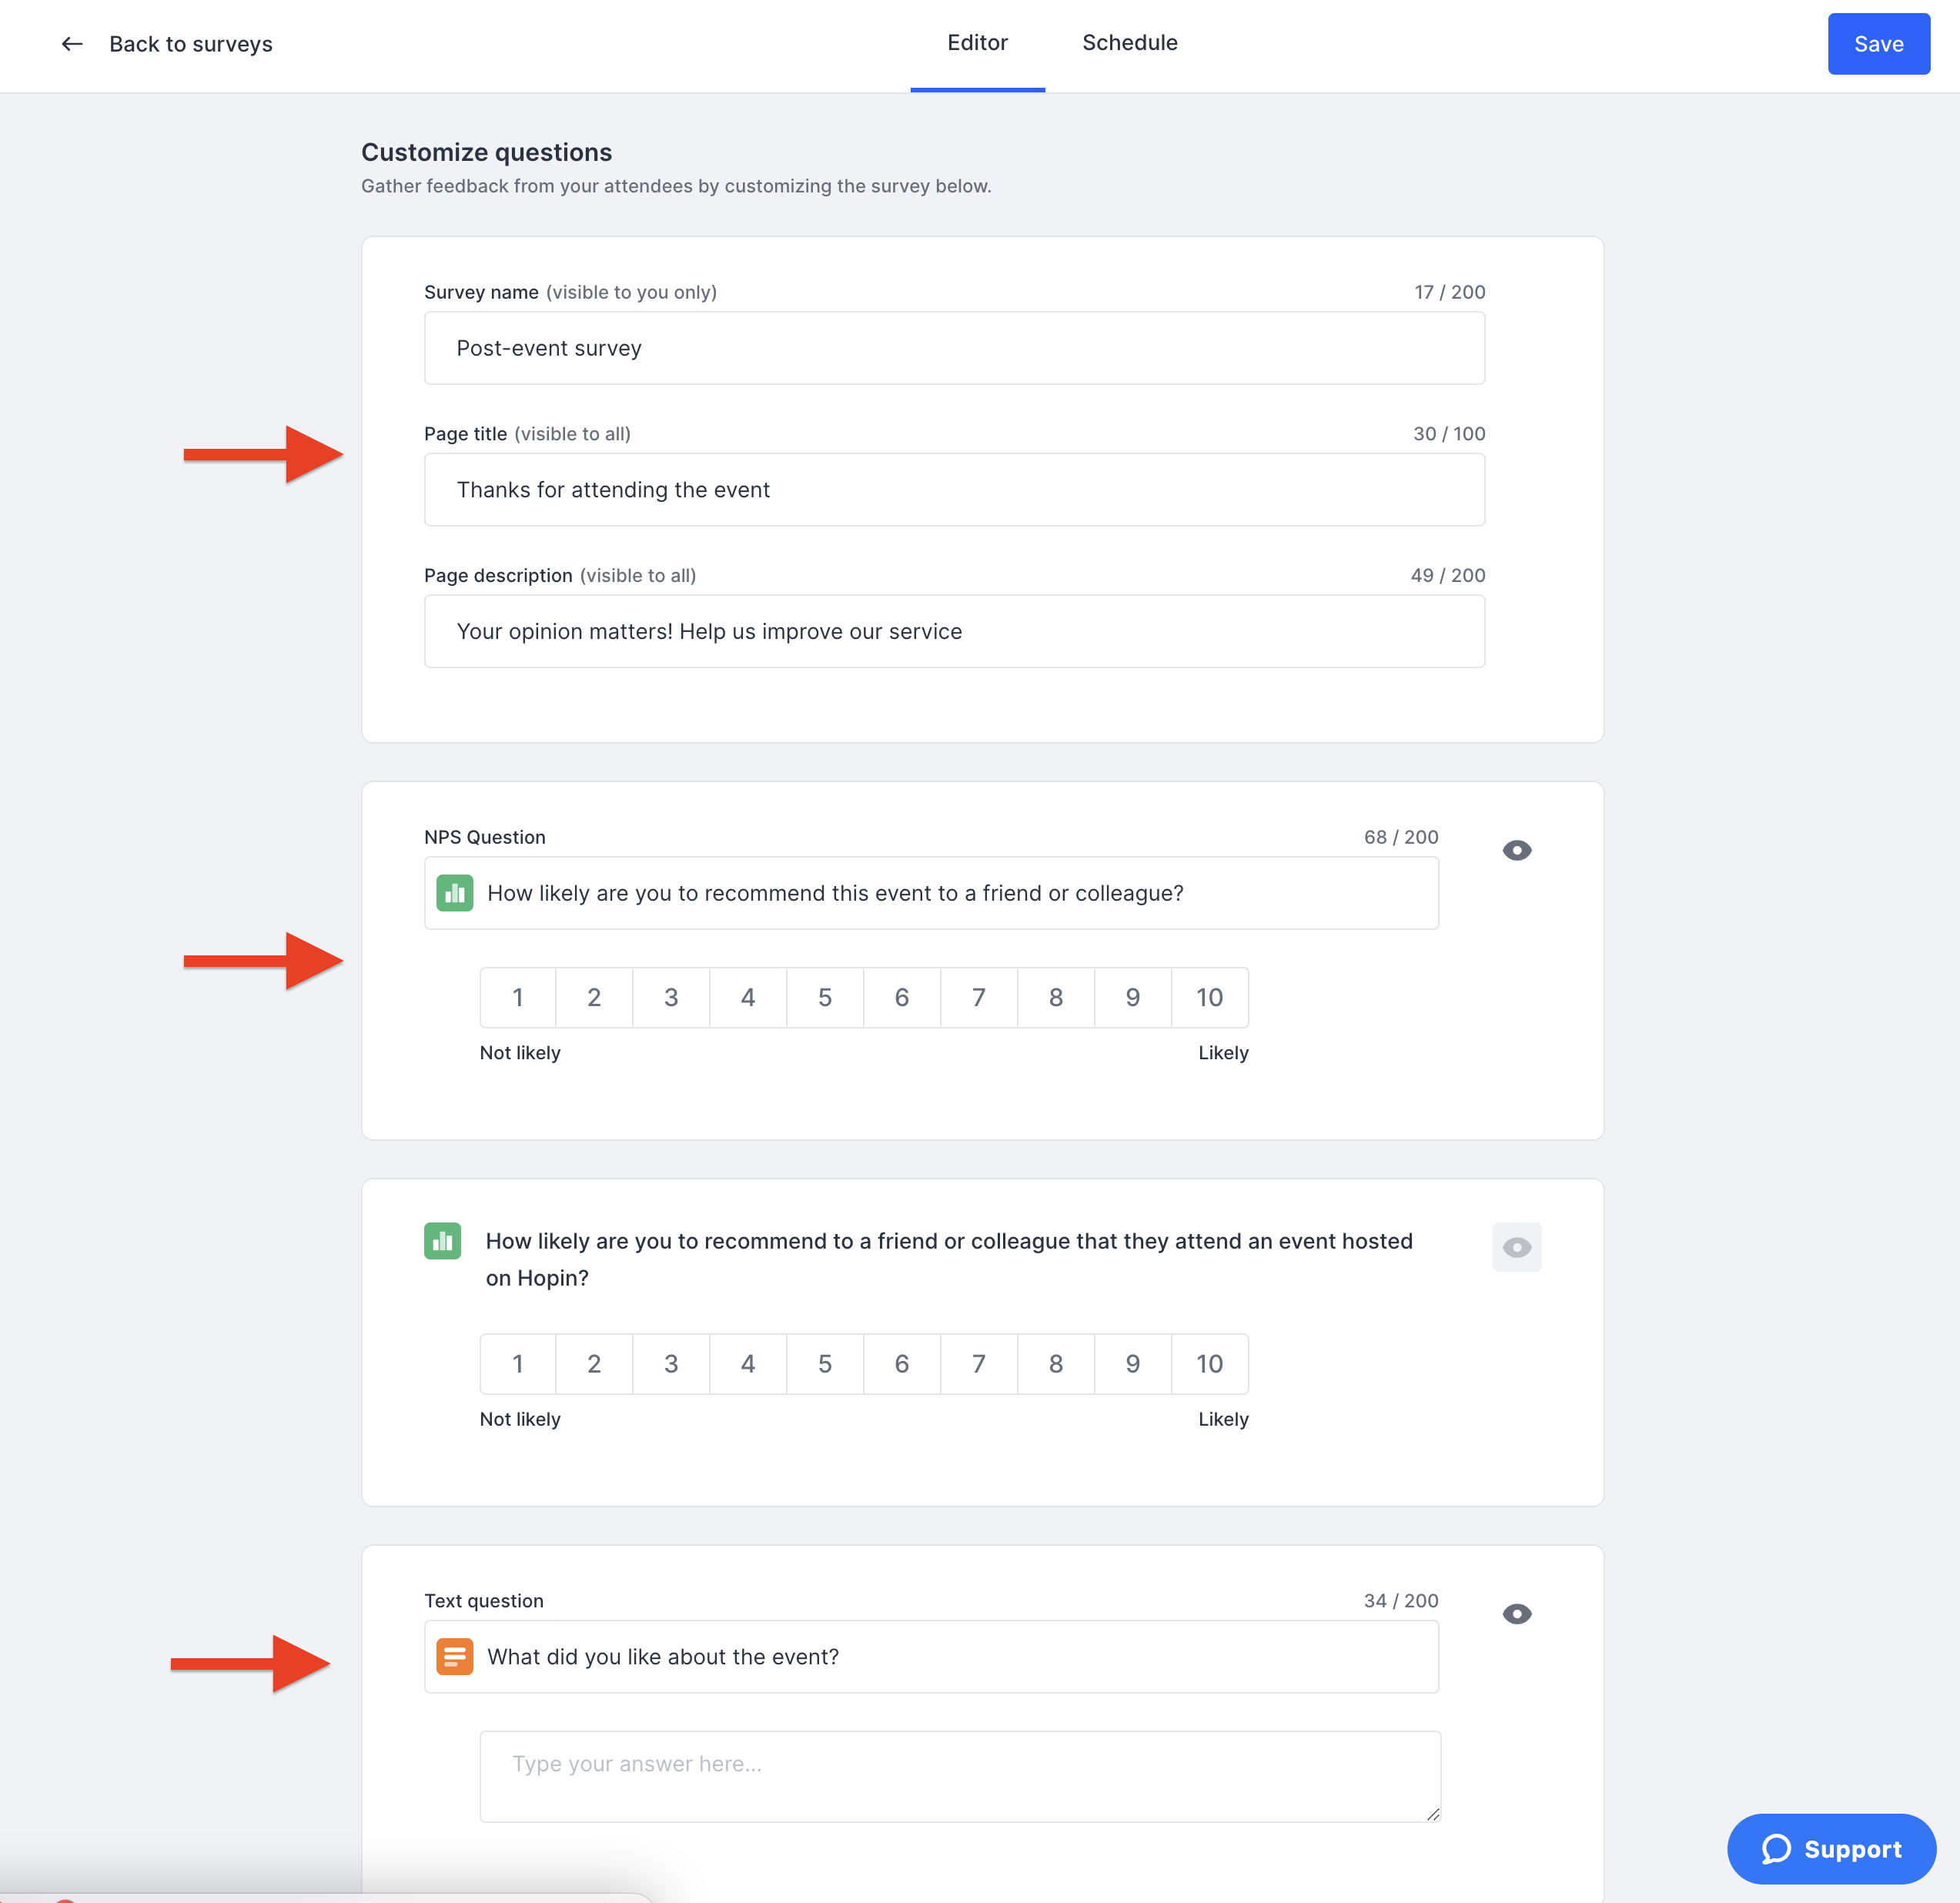
Use the Editor to change the text and questions of the survey.
After your Hopin event ends, you can export this custom survey data by going to Analytics>>>Reports.
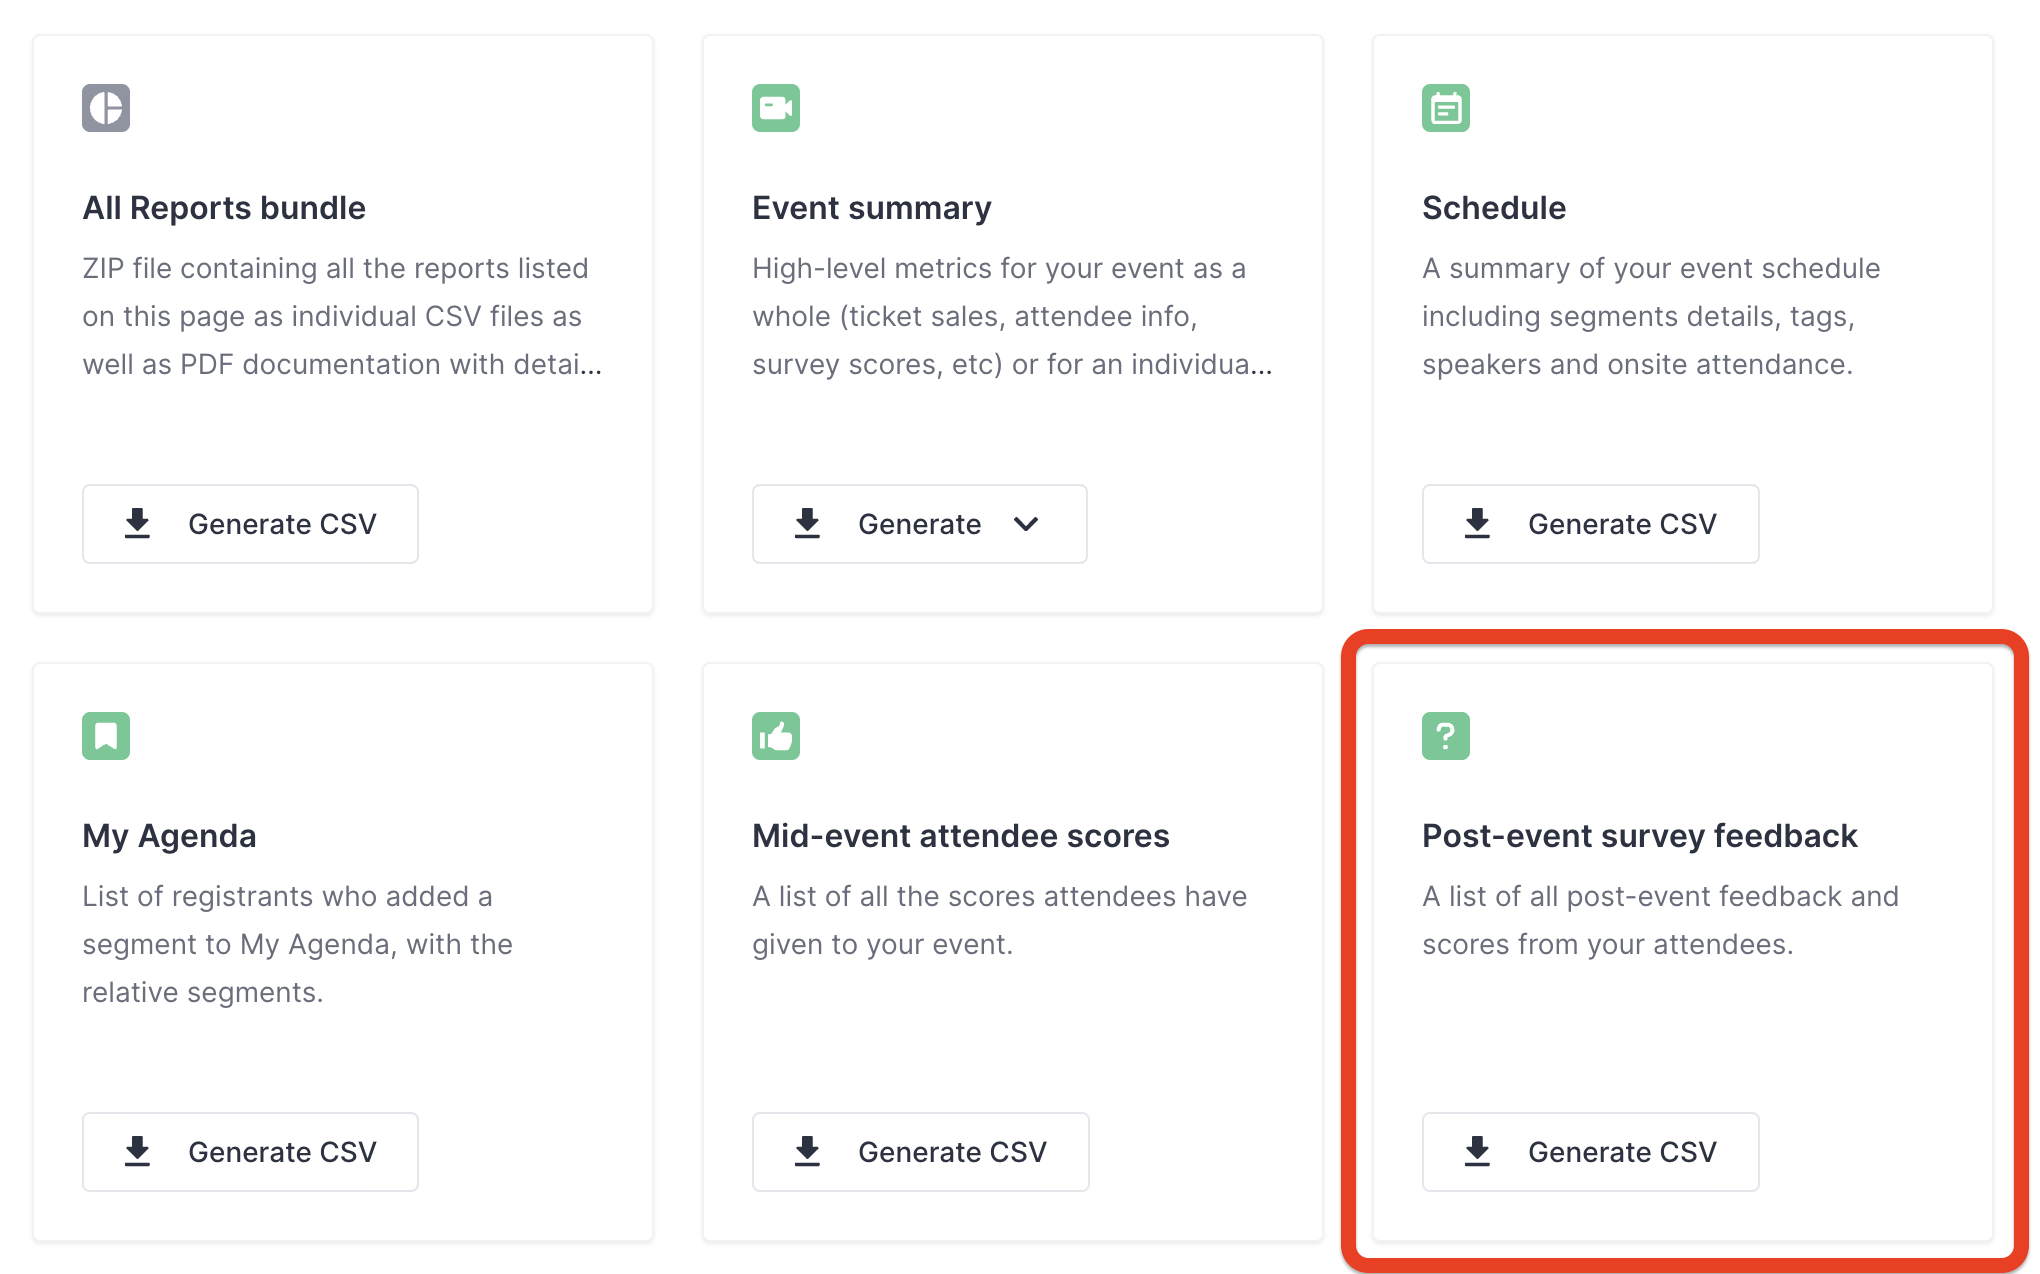
Click Generate CSV and you're done!
That's it for now. Stay tuned for more improvements coming soon.
 Team Hopin